
Brisk: A Buy vs. Rent, Sell vs. Keep Calculator That Tracks Opportunity Cost
Should I buy or rent? Should I sell now or keep it? These questions keep people up at night, and for good reasons. We’re often talking about decisions involving hundreds of thousands of dollars and decades of financial impact.
The problem? Most advice is either oversimplified (“renting is throwing money away”) or buried in spreadsheets that require an MBA to understand. So people guess. They go with gut feelings. They listen to whoever sounds most confident on YouTube, or at the dinner party.
The “smarter, personalized” advice is offered by online calculators. They do a bit more work, and paint a picture of expenses over the next decade – buying means a growing asset with principal getting paid off, and a rental market where rents keep going up every year.
But they all miss opportunity cost.
If you don’t buy that house, your downpayment doesn’t sit in a checking account, it gets invested. Over the last 15 years, the S&P 500 has delivered ~14.5% average annual returns. Housing? About 4%. That gap compounds dramatically over decades, and most calculators ignore it entirely.
I built Brisk to fix this. It’s a financial calculator that models the full picture: loans, appreciation, opportunity costs, taxes, and investment returns – all projected over time so you can see exactly when buying wins, when renting wins. And the more complex math of – if you’re already holding the asset, when selling wins and when keeping it makes more sense.
How Brisk Calculates
Under the hood, Brisk runs a month-by-month simulation for up to 30 years. For buying, it generates a full amortization schedule—tracking principal, interest, and remaining loan balance each month. The effective loan payment accounts for mortgage interest deductions, reducing your cost based on your tax rate. All recurring costs (property taxes, insurance, maintenance, rent) inflate annually at your specified rate, while the mortgage payment stays fixed.
For the renting scenario, Brisk takes your downpayment—the cash you’d have if you didn’t buy—and invests it at your specified return rate. Each month, it calculates the difference between what you’d spend buying versus renting. If renting is cheaper that month, the savings get added to your investment. If buying is cheaper, it deducts from your investment. This compounds monthly, giving you a realistic picture of how your “renting portfolio” grows over time.
When calculating sale proceeds, Brisk applies your appreciation rate year-by-year to get the future asset value, then deducts agent commissions, staging costs (inflated), remaining loan balance, and capital gains tax—accounting for exemptions like the primary residence exclusion. The result is your true net worth from buying at any given year.
The sell vs keep analysis is where things get interesting. For the “sell now” scenario, Brisk calculates what you’d walk away with today—current market value minus selling costs, loan payoff, and taxes. That lump sum then gets invested at your specified return rate. If you’d need to rent after selling (because it’s your primary residence), you can toggle on renting analysis and Brisk deducts monthly rent from your investment as it compounds.
For the “keep” scenario, Brisk tracks your monthly cash flow—rental income minus loan payments, taxes, insurance, and maintenance. If you’re cash-flow positive, that surplus gets invested and compounds. If you’re cash-flow negative, you’re effectively drawing down. At any future year N, your “keep net worth” combines two things: what you’d net from selling the appreciated asset at year N, plus (or minus) the investment position you’ve built up from your cash flows along the way.
The refinance toggle adds another layer. If you pull equity out today, that cash goes into your investment account immediately—but you’re now servicing a larger loan. Brisk models whether the market returns on that extracted equity outpace the cost of the bigger mortgage.
The full Brisk code is available here.
Buy vs. Rent
Let’s run through a concrete scenario. Let’s say you want to purchase a single family home in San Francisco.
- costs 1.32M on average
- with a 20% downpayment at 5.5%, 30-year mortgage
- our effective tax rate is 25%, so we’re able to deduct mortgage interest paid from taxes – reducing effective loan payment.
- 19K in annual property tax and insurance
- 10K per year in maintenance costs (typically 1% of home value per year)
- appreciating at 4% per year
We compare this purchase against renting an apartment for 5K per month, upfront security deposit of 10K, with another 3K in other annual expenses (renter’s insurance, etc).
To generate the asset net worth, we consider the cost of selling a home, with agent commissions of 6% and staging costs at 15K. And utilizing the 2 out of 5 years primary residence tax break of 500K in gains, with a long-term capital gains tax of 33% (in CA).
Note that all the costs (rent, property taxes, insurance, maintenance, etc., but mortgage is fixed) are inflating at 3% every year. We’re setting stock market returns to 10% yoy (lower than last 10-15 year of VOO returns at 13%-15%).
The Brisk calculator shows the:
- market returns over the last 15 years,
- calculates the effective loan payment,
- compares the total expenditure of buying vs renting (using it to determine savings while renting)
- calculates the net proceeds if the asset is sold at every future point in time
- the returns from investing downpayment and rental savings, and
- projects a picture of buying net worth against renting net worth over time.
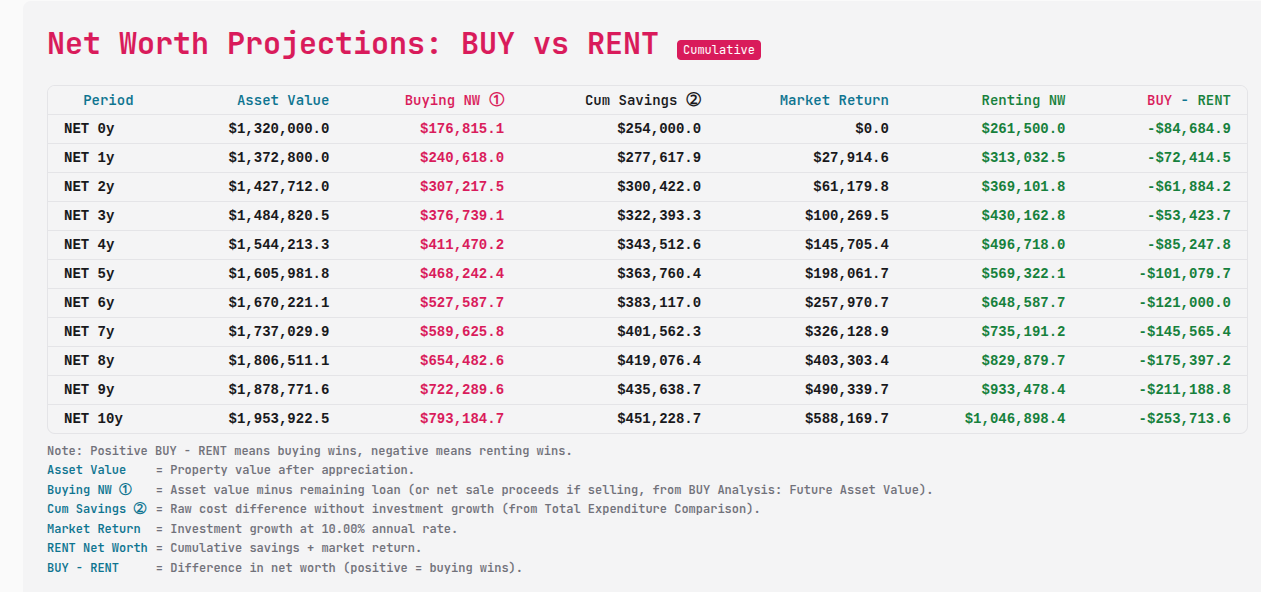
Scenario 1
In this case, over a 10 year time period, renting gives you ~250K more in net worth than buying. Over a full 30 year time period, you’d be worth a whopping 5M more by renting instead of buying – even though, your home has appreciated to 4.2M, and rent has more than doubled in this time frame. Brisk here
Scenario 2
Now, let’s change the equation with aggressive loan rate. Say, you know the mortgage rates are going to go down over the next few years to 3%, which seems aggressive at this point. Even with a 3% mortgage rate, over a 10 year timeframe buying is only ahead by 27K. Over the full 30-year timeframe, renting wins by a whopping 2.5M still. Brisk here
Scenario 3
Let’s change it one more time to include renting. Say, we’re able to rent out a portion of the home, earning 2K a month, with the 3% mortgage while living in the home. In this case, buying wins by 360K over 10 years, a whopping 2.2M over 30 years. Brisk here
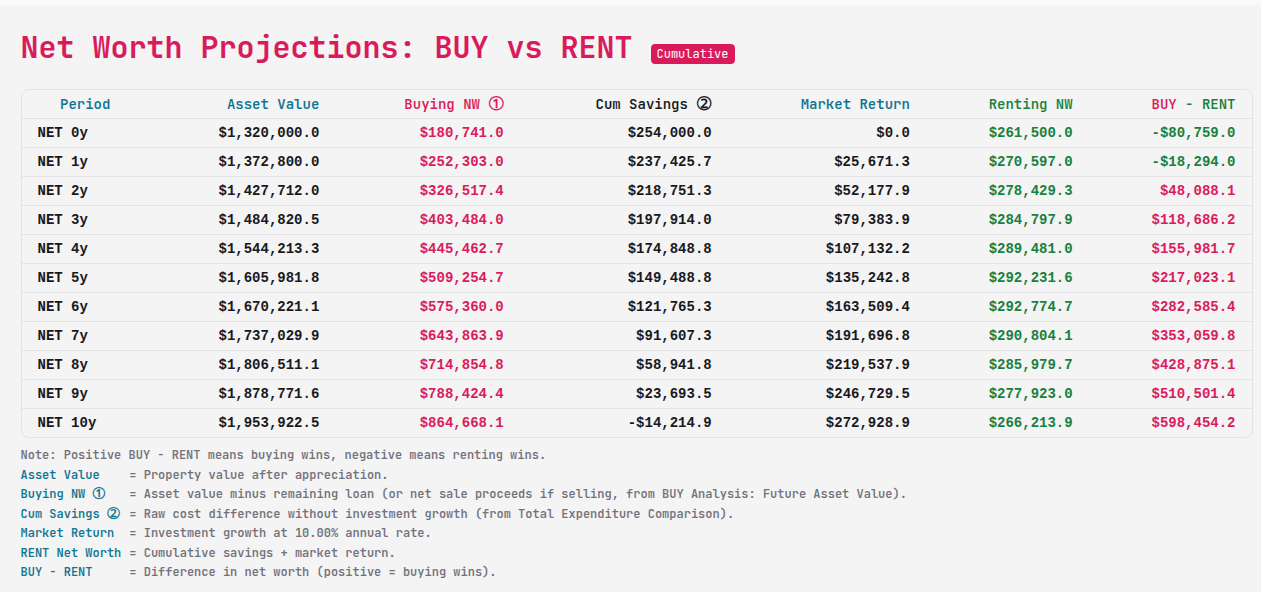
As you can see, numbers play a big role here. Despite having a really sweet mortgage rate of 3% compared to 5.5% in scenario 2, renting still wins out. But, earning income from primary home coupled with the 3% rate in scenario 3 changes the equation entirely.
Beyond Real Estate: Cars, Equipment, Anything
Brisk isn’t just for real estate. The same math applies to any major asset.
Should I buy a car or rent it as needed? Say the out-the-door cost of a new car is 45K and we have amazing discounts available over holidays. We’re able to get a 0-down, 0% APR for 5 years. Sounds like an awesome deal, doesn’t it?
Insurance, DMV fee and maintenance cost 3K per year. Say, the car depreciates at 20% in year 1, 15% in year 2, and 10% every year after. On the other hand, renting the car as needed costs 8K per year. Note again that all the costs, including car rentals (except loan payments) are inflating over time.
We also consider the new auto loan interest deduction (from the “One Big Beautiful Bill Act,” a 2025 US tax provision for American-assembled cars), applied against our effective personal tax rate of 25%. And we consider that while selling we’d lose another 1K from the car value during a trade-in. Brisk here
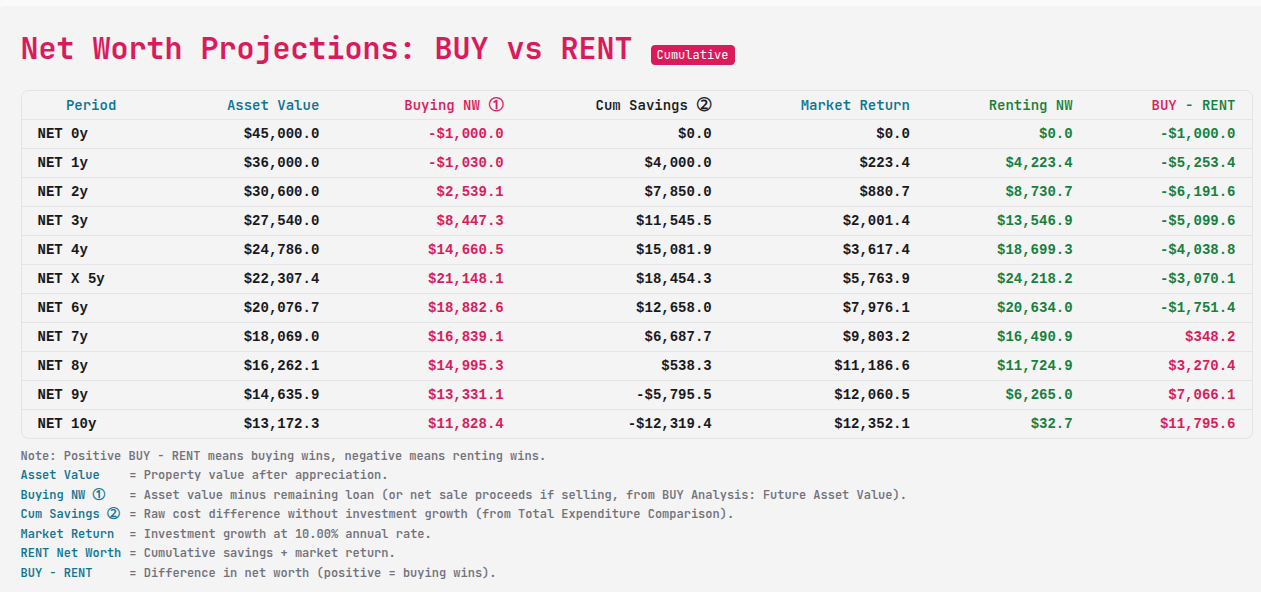
Over the course of the loan, renting is deterministically ahead of buying, peaking at 6K over buying the car at year 2. Once the loan is paid off, the difference starts to decrease, breaking even at year 7. So, if you typically keep your car for 5 years, you’d be better off renting the car as needed, investing the downpayment and savings. If you keep it for 10 years, you’re better off buying.
Of course, this doesn’t consider the convenience (or conversely, maintenance headaches) and emotional gratification of owning a brand new car instead of renting it. But, this shows you the numbers, so you can make a more informed decision.
Sell v Keep
This is what makes Brisk really interesting. Most calculators stop at buy vs rent decisions. But, what if you are already holding the asset and have built up equity in it. Should you sell it, or keep it? If you sell it, you might have to move to a rental home. If you keep it, should you refinance to get equity out to invest it?
This scenario is covered with 3 options:
- Sell vs Keep, where if you sell, you’d need to rent a place (include renting analysis)
- Sell vs Keep, where the asset is an investment property, and you don’t need to rent a place for yourself if you sell (no renting analysis).
- Sell vs Keep, where you want to refinance and get equity out to invest it in market (include refinance).
In all these scenarios, we:
- calculate the effective loan payment considering any mortgage tax deductions,
- the investment position we’d have if we were to keep the asset (positive if we’re earning more than spending, negative otherwise),
- calculate the net proceeds (for the keep scenario) from selling the asset at each future point in time, deducting sale and tax costs,
- determine the keep net worth as of year N.
We then compare it against selling the asset now, and investing it in the market, calculating the sell net worth as of year N. We then get the difference between SELL net worth - KEEP net worth, and determine the winner for each year.
Scenario 1: Let’s take an example. Say, you purchased a 1.5M dollar home, 5 years ago and it’s now worth 2M. Your original loan amount is 1.2M, at 5% interest rate 30-year mortgage, with remaining loan term of 25 years. If you were to sell this home, you’d need a place to live, so you’d have to rent a home at 6K per month, with 12K security deposit. The investment return rate is 10%.
In this scenario, even though sell seems to win in the short term, keeping wins over selling by 4.3M over the 30y timeframe, due to rising costs of rental home required after selling primary home. Brisk here
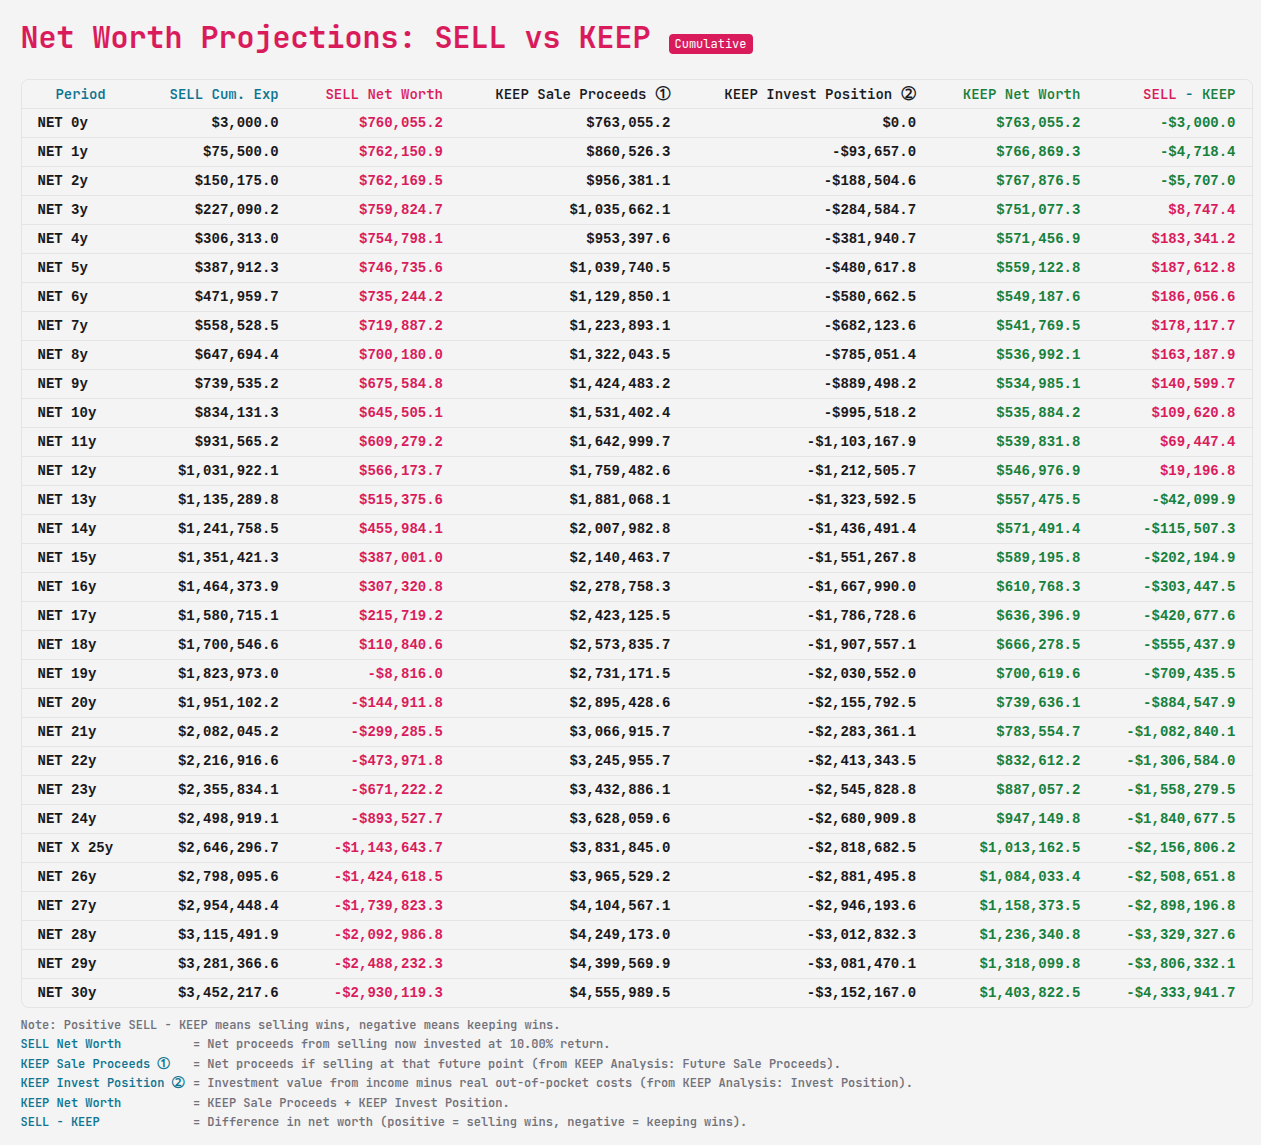
Scenario 2: Now, say this is an investment property and you’re earning 80K per year from renting it out (inflated over time). So, we remove the “renting analysis”, because we don’t need to rent a home if we sell this property (we already live elsewhere). In this case, despite the rental income, selling wins over keeping by 10M over 30 years. Brisk here
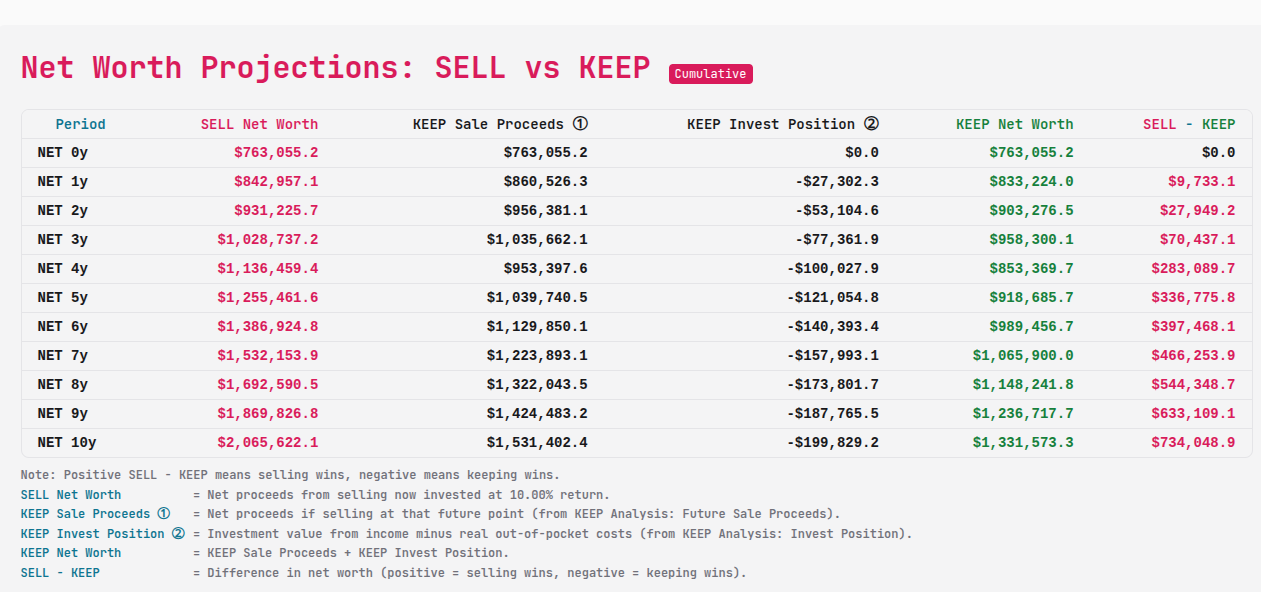
Scenario 3: We want to refinance the property, payoff the 1M principal (say), get a 1.2M dollar loan at 5% over 30 years, pay 5K in closing costs, cash out 195K and invest it. We’re still considering this as an investment property and turning off renting analysis on sale event. In this scenario, while keeping is ahead initially; selling wins over keeping by 7M over the 30 year timeframe. Brisk here
What Makes Brisk Different
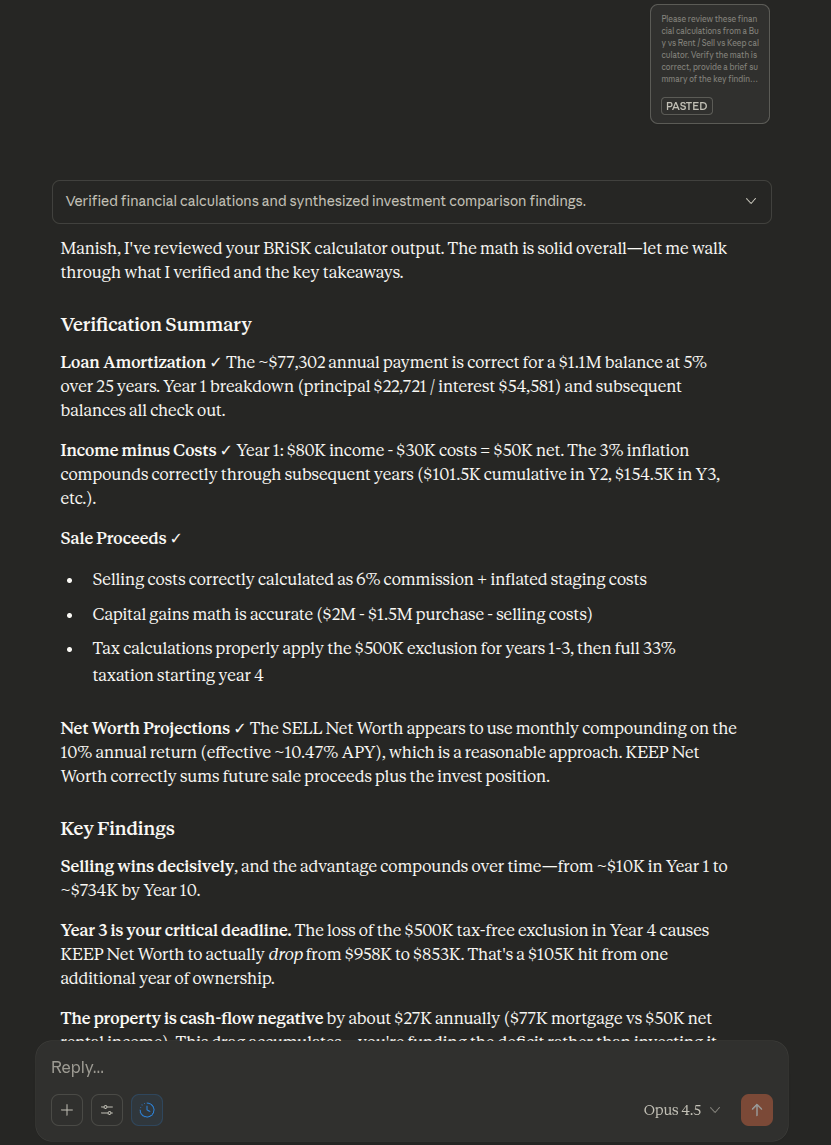
What if I want to sanity-check these numbers? Brisk is LLM-ready. Click the “Copy for LLM” button to get a pre-formatted prompt with all your inputs and results. Paste it into Claude or Gemini (I’ve found these handle the math most reliably) to double-check calculations, get clarifications, or ask further questions.
If you clicked on the links above to see the various scenarios, you can see that Brisk provides shareable links. You can run the numbers, click share and send the exact calculations to your partner, financial advisor, or that friend who keeps insisting that renting is a waste of money.
Brisk is also very “nerd” friendly. As a backend engineer myself, I wanted something that can be navigated using mostly keyboard. You can use arrow keys to navigate the input form, press ctrl+enter to calculate, press ctrl+s to save and ctrl+o to load previous saved calculations. All of these are stored locally. There’s no backend server which stores any of your numbers or calculations.
Brisk allows you specify not only appreciation, but also depreciation (for auto scenarios). Both numbers can be specified as a comma-separated array to indicate the years they correspond to. For example, -10,-10,-5 means the auto depreciates 10% in the first 2 years, and 5% every year after. It has similar arrays to specify tax-free capital gains for home sales.
Finally, I’ve tried to make the calculations as accessible as possible with helpful hints and text. The columns shared across tables have unique circled identifiers. You can click on these columns to scroll to their origin tables and see the calculations.
Make the Decision, Not the Guess
The goal isn’t to convince you to buy or rent. It’s to show you the numbers so you can decide with confidence.
Maybe you’ll discover that buying makes sense if you stay 7+ years, but renting wins if you might move in 3. Maybe you’ll find that your “investment property” is actually underperforming the S&P 500. Maybe you’ll realize the house you thought was too expensive actually builds more wealth than renting—or vice versa.
The point is: now you’ll know. Not just from expenditure perspective, but from investment opportunity cost and net worth perspective.
This is a good time to add the caveat. Neither stock market returns nor housing appreciation is guaranteed. Past performance, of course, is no guarantee of future results. Markets move any which way, and people react differently to the same events. If you’re the type who would panic-sell stocks when the market tanks 20% in a year, but can remain calm even if your home value drops 10% — then the equation changes in a way that can’t be captured by a calculator.
Brisk can’t give you nerves of steel. But it can help you make a more informed decision based on information available today.